Blog
by Sreevidya Ayyar, Uta Bolt, Eric French, Jamie Hentall MacCuish, Cormac O’Dea
The children of rich families tend to go to better quality schools, have higher cognitive skills, and complete more years of schooling. This blog exploits unique data from the National Child Development study to determine these early childhood factors go on to have long-run impacts on an individual’s lifetime earnings, perpetuating a cycle of wealth. These results suggest that policies that equalise investments, such as improving school quality, could promote income mobility.
Rich parents have rich children. Why is that the case?
The children of rich families tend to differ from their poorer peers in multiple ways. They have fewer siblings and more educated parents. Their parents spend more time with them and send them to better quality schools. Their cognitive skills are higher, and they complete more years of schooling. All of these channels have been found to affect an individual’s earnings. However, in order to design policies to improve intergenerational mobility, we need to understand how these channels interact with each other in generating correlations in lifetime income across generations.
Take the example of school quality. Attending a high-quality school may have direct long-run effects on an individual’s lifetime earnings by creating a more valuable professional network, for example. However, attending a higher quality school can also have indirect effects on lifetime earnings through improved cognitive skills and/or the student staying in education for longer. Each of these channels are more likely to benefit the kids of richer parents, who tend to have access to better schools. In a new paper we use mediation analysis to quantify the different channels through which parental income can impact an individual’s lifetime income. We find that intergenerational earnings persistence is mainly explained by differences in investments received during childhood, which in turn drive differences in cognition, years spent in education, and ultimately lifetime earnings.
We exploit unique data from the National Child Development Study (NCDS), which initially surveyed families of the entire population of children born in one particular week in 1958 and has followed them up until today. The NCDS contains rich information on: family income and circumstances during childhood, indicators of quality time that parents spent with the children, proxies for the quality of schools that they attended, measures of cognitive skills, as well as final educational outcomes and earnings throughout the lifecycle.
Table 1 shows gradients for some of our channels of interest by parental income tertile. The table shows that children from high-income households have fewer siblings and more educated parents than those born to lower income parents. Teachers report that high-income parents are more interested in the education of their children. Furthermore, children of high-income parents are more likely to go to schools where: parents attend educational meetings at age seven, student-teacher ratios are low at age 11, and a high fraction of students are doing GCEs at age 16 (an optional exam for progressing to further education). As a result, children from richer households develop greater cognitive skills; at age 16, reading scores were 21% of a standard deviation higher on average for children with high-income parents compared to children with low-income parents.
Table 1 describes only a subset of the variables we use. We combine these variables using a factor analytic approach to predict latent time investments, school quality and cognition, similar to Heckman et al. (2013). The factor analytic approach allows us to use all measures available to us by treating them as noisy measures of school quality, parental time, and cognition.
Table 1 Sample means, by parental income
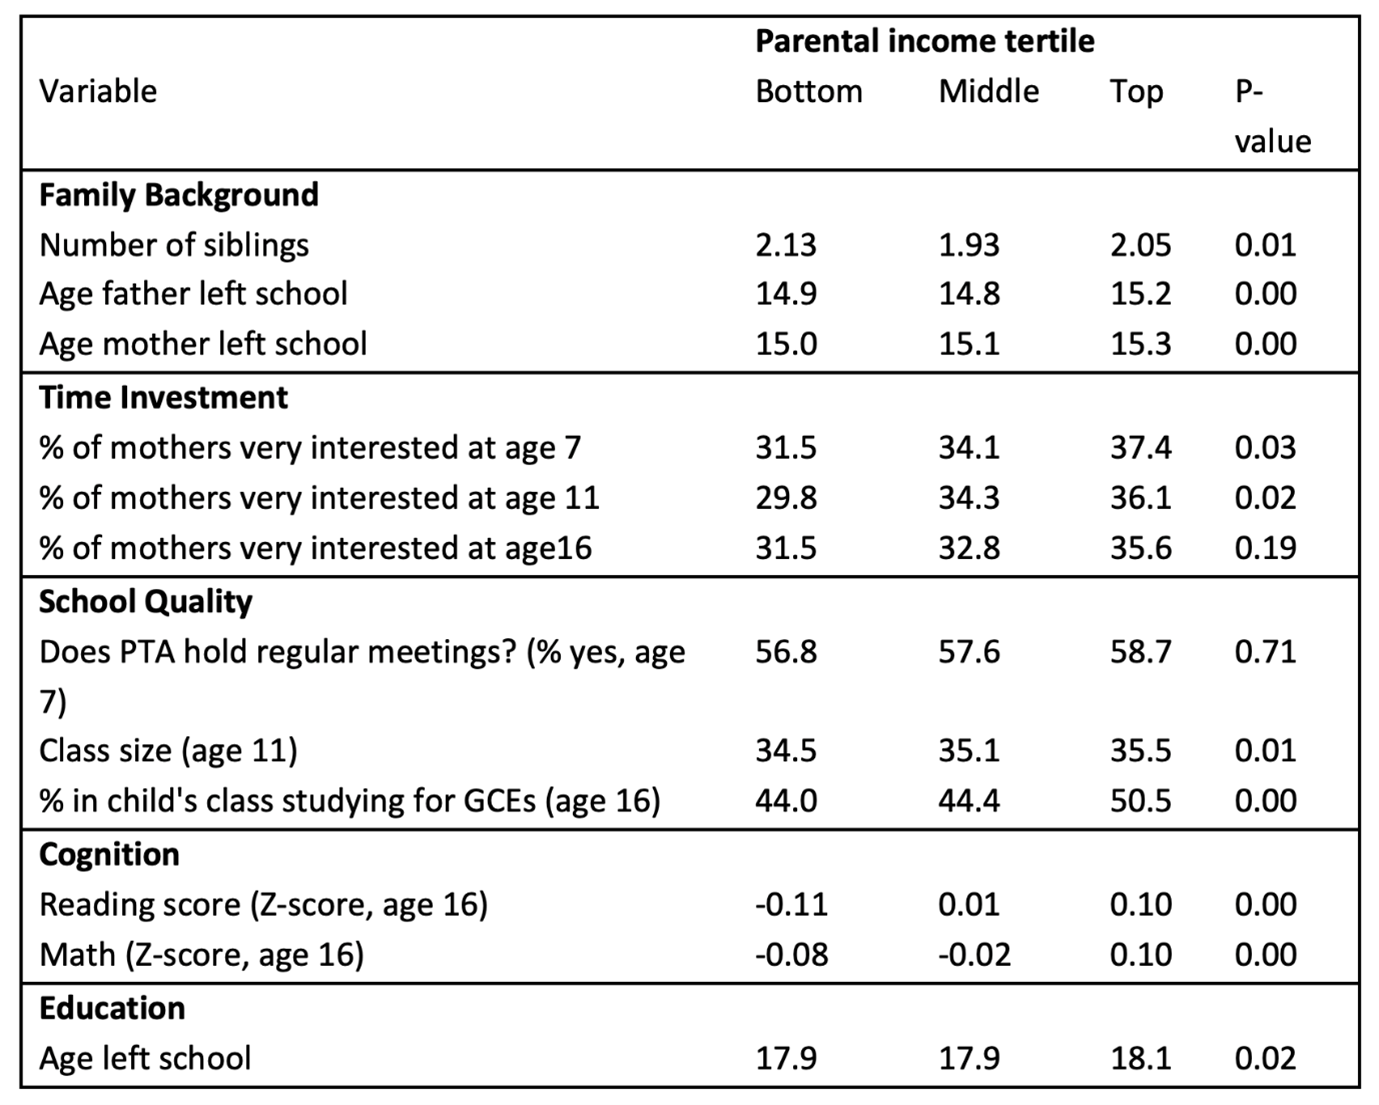
Note: The final column reports P-values from the F-tests testing the null hypothesis of equality of means across parental income tertiles. The time investment measures are teacher-reported measures asked when the children are 7, 11, and 16. Teachers can evaluate parents as very interested, a little interested, not interested at all. We report the fraction of mothers and fathers who are very interested.
We find the intergenerational elasticity of earnings, or IGE (which is a measure of the relationship between parental and child lifetime income), to be 0.32 for men and 0.24 for women. The first part of Figures 1 and 2 shows the fractions of this relationship explained by differences in family environment, time investments, school quality, cognition at 16, and completed years of schooling when we only allow for direct effects of each variable on lifetime income. These variables explain over half of the IGE –– 54% and 62% for men and women, respectively (the remainder is explained by factors beyond the ones we consider, such as better job networks).
Figures 1 and 2 summarise the main for results for men and women respectively.
Figure 1
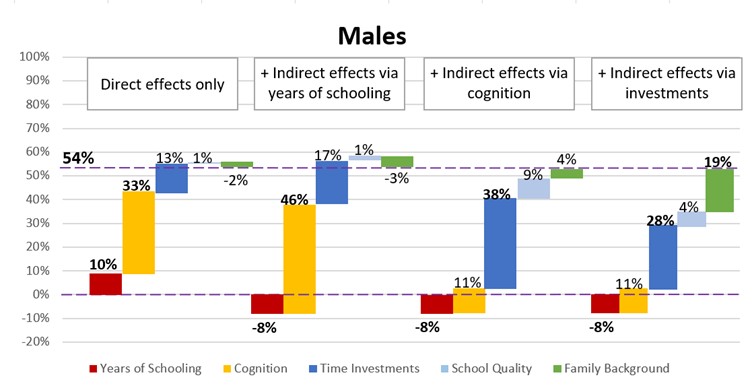
Figure 2
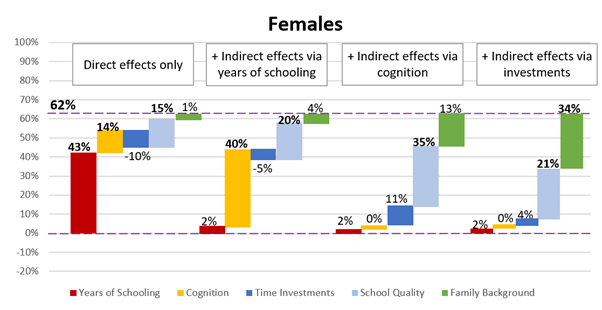
In the first panel of each figure, we find that years of schooling and cognition explain significant and large fractions of the IGE, both for men and women. We then investigate whether schooling and cognition are driven by earlier life investments and family background.
In the second panels of Figures 1 and 2, we allow for indirect effects via years of schooling. For example, for cognition, we now additionally account for its effect on lifetime income via its effect on years of schooling. Doing so, we find that the fraction of the IGE that was previously explained by differences in years of schooling can actually be explained by differences in cognition, instead. This suggests that it is not parental income per se, but the higher cognitive levels of children of high-income parents that encourages higher educational attainment.
The next level of our analysis, illustrated in the third panel of each figure, addresses the sources of cognitive skills. We allow for parental time investments, school quality, and family background to affect the IGE not just directly and via years of schooling, but also via cognition. We then find that the fraction of the IGE that comes from the cognition gradient can largely be explained by differences in time and school quality investments received during childhood. This is consistent with previous literature that has found significant effects of parental investments on cognitive development.
Lastly, we let family background – which comprises mother’s and father’s education, and number of siblings – have an indirect effect by affecting investments. Once we do so, family background explains 19% (34%) of the IGE for men (women). This contrasts with the zero effect of family background that we find in our baseline analysis. In other words, family background matters, but only because it affects investments, which then affect cognition and years of schooling. This result is consistent with Carneiro et al and Akresh et al. who find that increases in parental education lead to more favourable child outcomes. However, we also find that even if we control for family background, the remaining parental income gradient of investments explains 28% of the IGE. This suggests that higher parental income directly leads to higher investments in children, and not only runs through family background, a point which we have developed in greater detail in a forthcoming paper. This supports Bastian and Lochner’s (2021) conjecture that the increase in financial resources from programmes such as the Earned Income Tax Credit are what drives improvements in child outcomes.
Thus, we conclude that the main driver of intergenerational earnings persistence are differences in investments received during childhood which subsequently leads to improved cognition and more years spent in education. Many of these investments, such as school quality, are the subject of public policy debate. Our results suggest that policies that equalise these investments could improve income mobility.
The Intergenerational Elasticity of Earnings: Exploring the mechanisms, is research by Uta Bolt, Eric French, Jamie Hentall-MacCuish and Cormac O’Dea.
By Matthew Hall, Research Fellow with CILIA-LGBTQI+ at the University of Surrey
The media, policymakers and marketing organisations all love their generational labels. Over the last decade all-to-familiar terms like ‘Boomer’, ‘Millennial’, ‘Gen X, and now ‘Zoomer’, have come into popular use, narrowly classifying vast groups of people who share their formative years during the same approximate socio-historical period.
Recently, the credibility and use of these classifications have been rightly scrutinised. This is largely due to their non-empirical origins in consumer marketing strategies, their use as a political smokescreen and their tendency to overstate intergenerational conflict and pit social groups against one another.
Sensationalist and provocative headlines such as “Why millennials’ distaste for Baby Boomers is justified”, “Our Weak, Fragile Millennials” and “Boomer v broke: why the young should be more angry with older generations” have become commonplace within a time when swathes of mainstream news outlets have become caught in a tide of propagating the so-called ‘Culture Wars’.
However, one equally relevant, yet often overlooked, concern is that these narratives tend to overstate shared generational experiences within each birth cohort. They disregard ways in which historically marginalised groups of people, such as those identifying as lesbian, gay, bisexual, trans, queer or intersex (LGBTQI+), may share completely different generational experiences, marked by completely different formative historical, social and political developments.
Our research conducted over the last three and a half years, as part of the CILIA LGBTQI+ (Comparing Intersectional Life Course Inequalties amongst LGBTQI+ Citizens in Four European Countries) project, highlights just how poor these marketing classifications are for understanding LGBTQI+ lives. The project undertook extensive lifecourse interviews with 48 LBGTQI+ citizens within England from an array of ages, social and regional backgrounds, ethnic identities, and dis/abilities. The results suggest that whilst there are some distinctive generational differences between those identifying as LGBTQI+, these do not map neatly at all upon traditional frameworks.
Firstly, socio-historical developments are often used to define generational cohorts – for instance, a dramatic population spike and increase in living standards typically marks the Baby Boomer generation. However, for our respondents, these were set against more LGBTQI+-specific social, historical, and political developments.
For example, the Stonewall riots of 1969 and subsequent decriminalisation of homosexuality across Western countries during the late 1960s and early 70s, as well as the introduction of civil partnerships and equal marriage, appeared far more formative for generations of LGBTQI+ individuals. Likewise, less-progressive developments such as Section 28 – restricting any promotion of homosexuality as a ‘pretended family relationship’ by UK local authorities (including schools) from 1988 until 2000 (in Scotland) and 2003 (in England and Wales) – also featured heavily as important generational markers with longstanding legacies.
Meanwhile, other events more specific to transgender and queer individuals, such as the Gender Recognition Act (2004) in the UK, were equally formative for their queer generational identifications. Even ostensibly universal socio-historical developments, such as the information age and widespread digital literacy, can be experienced differently based on one’s position and needs within society. For example, fairly recent concerns about the impact of digital technologies on the dating economy for Millennials and Zoomers, appears to ignore many gay men and women’s reliance on technologies (and previously newspaper ‘personals’) for the best half of a century. Perhaps ‘Gay Boomers’ were just Millennials ahead of their time?
Secondly, our respondents’ queer generational identifications did not always correspond with neat and discrete birth cohorts, nor shared turning of adolescence, as has come to be expected of generational groupings. When discussing the introduction of civil partnerships in 2004, a gay trans male respondent, who had been working in the armed forces, puts it aptly: “[…] civil partnerships came in, and you were allowed to marry and get married quarters and all that sort of stuff […] So, there was definitely changes, and people were a bit more open about it. But that didn’t really affect me because I wasn’t same sex attracted, and I didn’t understand the gender thing then. Like I say, I didn’t understand it at that point, so…”.
Cases like these raise the question as to whether queer generational cohorts may be better framed by when individuals first become self-aware of their same-sex attraction, begin questioning their gender identity, ‘come out’ to others, begin identifying with a wider LGBTQI+ community or when they enter ‘queer spaces’ for the first time. A 50-year-old who has only recently begun to think about themselves in terms of sexual identity, for example, may share more formative experiences with much younger LGBTQI+ individuals than with their own peers. As such, queer generations could be understood as the mutual phasing between queer-specific socio-historical developments and a personal queer lifecourse.
Overall, despite more recent social change, many LGBTQI+ lives remain outside of what we might think of as normative generational experiences. It is important that pervasive and universalising narratives about generational difference do not further marginalise queer lives and render them invisible. How we effectively talk about generations should account for both the diversity of LGBTQI+ lives and varied experiences of social, historical and political developments.
King, A. and Hall, M.A. (forthcoming 2022) ‘Re-thinking Generations from a Queer Perspective: Insights and critical observations from the CILIA-LGBTQI+ Lives in England project’, in H. Kingstone and J. Bristow (Eds.) Studying Generations: multi-disciplinary perspectives, Bristol: Policy Press. The book is part of the Bristol Policy Press open access series.
by Alexander Ludwig and colleagues
This blog was first published by VOXeu.
After the outbreak of the COVID-19 crisis in the spring of 2020, politicians around the world closed schools and child-care centers together with businesses in an effort to contain the virus. According to the World Bank, around 1.6 billion school children were affected by these closures at their peak. While the economic costs of closing businesses arise immediately and are thus very salient, closed schools and child-care centers have negative economic effects on the human capital accumulation of children that only arise in the long run. Education is a crucial determinant of future wages, and schools are an important driver of intergenerational mobility. In the short-run, parents, and especially mothers, are struggling with combining work and child care while schools are closed, but what are the long-run economic impacts of Covid-related school closures on the affected children?
A model of schooling and parental investment into children
To answer this question, we build a model that features public schooling as input into the human capital production of children, as well as monetary and time investment of parents into their children. At the core of the model, there is a human capital production function that features self-productivity, i.e. human capital builds on itself, and complementarity, i.e. the higher the human capital, the more productive is investment into human capital (Cunha and Heckman, 2007; Cunha, Heckman and Schennach, 2010).
From age 4 to age 16 children reside with their parents who invest time and resources into their education, which, combined with public expenditures, governs the evolution of human capital of the children from kindergarten through high school. At the age of 16, high-school students decide whether to stop schooling and start working, to complete high school, or to obtain a college degree. At that time parents endow their children with intra-vivo transfers that can be used to finance higher education. The terminal school degree (college, high-school, high-school dropout) as well as the human capital accumulated during their schooling period determines wages of the children once they enter the labor market.
We calibrate the model to data from the US. Parents are heterogeneous with respect to marital status, education, income, and assets. Parental characteristics affect not only the innate ability of their children, but also the optimal investment into their children. We model the school and child-care closures as a drop in governmental investment into children corresponding to school closures of six months. In addition, the COVID-19 shock comprises a fall in parental income through increased unemployment, with a larger incidence for less educated parents. We then use the model as a laboratory to ask how parents react to these shocks, and what are the ultimate labor market and welfare effects on the children?
Our main results are summarized in Table 1. We find that the children affected by the school closures suffer long-run average wage losses of -1%. These wage losses lead to a reduction in welfare corresponding to a consumption equivalent variation of -0.7%. An important driver of the long-term wage losses are changes in the final educational attainment of the children; the table summarizes the percentage point changes in the education shares. Translated into percent changes, the share of college educated children falls by -2.6%, and the share of high school drop-outs increases by 4.1%, due to the fact that the children impacted by COVID-19 school closures early in their life arrive at age 16 with significantly less human capital than in the absence of COVID-induced school closures.
Thus, there are significant permanent negative effects associated with a purely temporary shock. For the children, the negative effects of the temporary school closures are much more important than the negative effects caused by the temporary income drop of their parents: school closures account for 90% of their overall welfare loss.
Table 1: Aggregate Outcomes of School Closures and Income Recession
| Baseline | change for children of biological age | ||||
| average | 4 | 6 | 14 | ||
| change in %p | |||||
| share s=no | 12.15% | 0.50 | 0.56 | 0.67 | 0.31 |
| share s=hs | 54.53% | 0.38 | 0.27 | 0.32 | 0.43 |
| share s=co | 33.32% | -0.88 | -0.83 | -0.99 | -0.74 |
| change in % | |||||
| PDV gross earn | $784,196 | -0.99 | -0.96 | -1.19 | -0.77 |
| CEV children | – | -0.70 | -0.72 | -0.84 | -0.54 |
These negative effects emerge despite the optimal efforts of parents to offset the impact of school closures by increased parental time and resource inputs into their children’s education. On average, parents increase their time investment into children by 3.8%, and their monetary investment by 5.1%. However, due to their own income loss, parental intra-vivo transfers fall by -0.3%. These changes imply welfare losses of -0.3% for the parents themselves.
The average long-term gross earnings loss of -1% for the children translates into a net earnings loss of -0.8%, assuming no changes in the tax and transfer system. Given the progressivity of labor income taxes, the lower average earnings lead to disproportionally lower tax payments. Thus, while the tax system to some degree shelters children from the future negative income effects, the flip side is that future government revenues fall by more than the gross earnings loss endured by these future workers, namely by -1.8%. Thus, COVID-19 school closures in the short-run foreshadow a substantial fiscal crisis in the long run.
Younger children and children from disadvantaged households suffer more
The earnings and welfare effects of the school closures depend significantly on the age at which they happen. For children aged 6 who are about to start primary school when the COVID-19 school closures occur, long-term earnings losses amount to -1.2%, with associated welfare losses of -0.8%. By contrast, for children aged 14, these losses are approximately one third lower, amounting to -0.8% and -0.5%, respectively. The reason for this age pattern is that human capital builds on itself, and lower human capital leads to lower optimal investments in the future.
Thus, for children aged 6, parents optimally increase their investments at the time of the closures but cannot completely offset the human capital loss on impact. This leads to lower parental investments in future periods, relative to a world without the school closures. Compared to children of age 6, younger pre-school children are somewhat sheltered from the negative effects of the closures, because at that age parental investments play a more important role for human capital accumulation than governmental investments.
In addition to the age of the child, parental characteristics are a crucial determinant of the magnitude of the earnings and welfare losses for children from the COVID-19 crisis. The welfare losses of the school closures for children are decreasing in parental education as well as in parental assets. Well-to-do parents have more resources to help out their children during the school closures, and also have a higher incentive to do so.
Their children have on average higher human capital than the children of less well-off parents, and thus, given the complementarity of investments and human capital, larger investment increases after the school closures subside are optimal for them. Therefore, the role of parental characteristics for the school success of children is amplified by the COVID-19 school closures.
Prolonged school closures make the effects worse
The current second Covid-19 wave in the fall of 2020 makes prolonged school closures a reality in some school districts, and renewed school closures a possibility in many more. We find that the welfare effects of one-year school closures are more than twice as large as the welfare effects of six months school closures. The loss in schooling and associated human capital accumulation is harder to offset the longer the crisis lasts.
Hybrid and digital teaching
Many schools relied on various forms of digital teaching during the school closures, and nowadays implement hybrid teaching formats, combining in-person instruction and remote teaching. The literature thus far provides only scant evidence on the effectiveness of online vs. in-person instruction, and thus it is hard to gauge the long-run consequences of digital teaching.
Yet, there is evidence that children from disadvantaged households have less access to and/or make less use of digital forms of teaching during the current crisis. Opportunity insights reports that student participation in online math work decreased immediately for all children at the start of the school closures, but ultimately decreased by 41% for children from low income ZIP codes by the end of the school year compared to January 2020, by 32% for children from middle income ZIP codes, and not at all for children from high income ZIP codes.
It is plausible that both the equipment for digital teaching among teachers, as well as the equipment and the provision of quiet learning spaces for the students depend on socio-economic characteristics. While we cannot put hard numbers on the differential use of online learning by parental characteristics, our model allows us to trace out the heterogeneous wage and welfare effects, by parental background, when the length of school closures is negatively correlated with socio-economic characteristics of the parents.
For example, if one assumes that the school closures in combination with distance learning opportunities correspond to a complete school closure of 3 months for children of college educated parents, but of 6 months for children of high school dropouts, then the welfare impact is -0.7% for the latter group, but only -0.3% for the former group.
Conclusion
School and child-care closures have significant negative long-term consequences on the human capital and welfare of the affected children, especially those from disadvantaged socio-economic backgrounds. This reduction in human capital accumulation is likely slowing the long-run growth prospects of countries, especially those whose economies are relatively human capital intensive, such as the U.S. and Europe.
Thus, school and child-care closures are potentially very costly measures to avoid the spread of the Covid-19 virus. This point was initially largely lost in the political debate, likely because these negative effects arise only in the long-run and thus are not immediately measurable. Medical research now also indicates that children are not the primary drivers of the COVID-19 pandemic, in contrast to pandemics caused by the influenza virus.
During the current second wave of the crisis in the fall of 2020, governments seem more committed to keep schools and child-care centers open as long as possible. For example, Germany and France are closing restaurants, bars, and the entertainment industry during their “lockdown light” in November 2020, but not schools and child-care centers. Our research suggests that this policy choice has the potential to pay significant long-run dividends for future generations, even though it might contribute to a more rapidly evolving second wave of Covid-19 infections in the short-run.
The Long Term Distributional and Welfare Effects of Covid-19 School Closures, by Nicola Fuchs-Schündeln, Dirk Krueger, Alexander Ludwig and Irina Popova, was published by the Centre for Economic Policy Research in August 2020: CEPR Discussion Paper 15227.
by Maggie O’Neill, National University of Ireland, Galway
The effects of COVID19 have challenged societies and healthcare systems across the world.
And that impact has been especially pronounced for the working lives of nurses, who work in front-line roles, a new study reveals.
“I feel that we’re still basically seen as the handmaidens of the health service. And I wouldn’t have felt that before the pandemic, but I do now.”
These were the words of Martina – not her real name – who was one of 25 older nurses we interviewed for a recent research study on how the pandemic has affected older nurses in Ireland.
By giving voice to older nurses in Ireland in this way, we hope to provide understanding of their experiences at this time of crises, to identify the resources that are needed to support them to keep working or in their pathways to retirement, in the context of a health system in Ireland that was already under-resourced before the pandemic.
Our qualitative study focuses on the experiences and views of older nurses in Ireland of working through the pandemic to explore, firstly, what are the main impacts of the pandemic on the working lives of older nurses in Ireland, including theirs and their families’ health and wellbeing? And, secondly, how does the pandemic affect their retirement timing decisions? Twenty-five nurses aged 49 and over participated in telephone or online interviews, sixteen women and nine men. Pseudonyms are used in this article.
Poor health impacts
Our key finding was that many older women nurses in Ireland are now seeking to retire early. The findings stem from interviews carried out in early 2021, representing a follow up to in-depth interviews about their working lives with the same nurses prior to the pandemic. While some nurses respond positively to the pandemic, expressing a renewed sense of invigoration, most report poor health impacts, with several experiencing stress and exhaustion, and some contracting the virus and passing it on to their families – a predominant fear for all nurses and especially those with caring responsibilities.
James, whose mother is in her nineties and living at home, underlines these concerns:
“You’re nearly scared to go to work and then you’re nearly scared to come home in case you’re taking something back home”.
Many of the women nurses describe feeling pulled between staying on or retiring early, with over half now planning to retire early. Martina explained:
“I just don’t feel I can do this until I’m 65, Nor do I want to … whether I’ll just in another couple of years say, to hell with it, I’m hanging up my boots and I’m leaving, I don’t know. I wouldn’t like to think I will. Because … this is my 40th year working in health. And I would hate to think that I’d bow out like that.”
Gender divide
As most of the men nurses say that the pandemic does not affect their decision to retire, a clear gender divide emerges.
In terms of public recognition for the role, Martina draws attention to the futility of the practice introduced during the pandemic of clapping for healthcare workers when…
“We’ve lost staff … we’ve looked after people in spite of it …”.
A similar view is echoed by several of the nurses interviewed.
On a personal level, many nurses say that their perception of the role hadn’t changed – they would expect to do the same work regardless of the conditions. Some express an increased sense of pride in themselves and in their profession, distilled by their experience of working through the pandemic. As Bridget says:
“We can offer so much to patients … seeing nurses holding that patient’s hand, when … the family member couldn’t come in, they’re at end of life … and sitting there reassuring them … to me, that was the essence of nursing”.
New and timely insights
Our research provides new and timely insights into the impact of COVID-19 for older nurses in Ireland. Age, health and caring responsibilities represent important considerations for men and women, but more so women, if they are leaning to retiring earlier.
These findings about nurses’ responses to working through the pandemic demonstrate the need for nuanced employer and government policies that provide supports including not only improved infrastructure and increased staffing levels but also flexible work options, consideration for staff who care for vulnerable family members, and pre-retirement schemes.
In a health system that was already under resourced and under pressure prior to the pandemic, actions rather than words are now needed to recognise the indispensable work of older nurses.
- The Impact of the COVID-19 Pandemic on the Working Lives and Retirement Timing of Older Nurses in Ireland, is research by Áine Ní Léime and Margaret O’Neill and is published in the International Journal of Environmental Research and Public Health.
by Paul Hufe, University of Bristol
Inequality is on the rise in many countries across the globe. The implications of these changes for social justice are hotly debated. In recent work, we have developed a new measure of unfair inequality and used this measure to study unfairness in the US and 31 European countries. We found inequality and unfairness had gone hand in hand in the US since 1980. Today, the US emerges as one of the most unfair societies in the West.
Do differences in incomes reflect discrimination and a lack of opportunity for social groups, or do the inequalities we can see simply reflect the just deserts of more or less hard-working individuals? Many of us have our own answers to these questions. However, to advance the broader debate and to discuss policy responses, we cannot rely on individual perceptions alone. Instead, we need to have a toolbox that allows us to compare the current state of the world with what we think a fair society should look like.
In our recent work we provided such a toolbox. To date, fairness discussions have mostly homed in on comparisons of inequality across countries and time. In these discussions Scandinavian countries typically emerge as paradisal islands of fairness whereas soaring inequality has made the US seem a kingdom of unfairness.
However, comparisons based on inequality alone do not tell us much about fairness. The reason is that the underlying measures for such comparisons condemn all inequality as unfair and cannot account for more nuanced perspectives on what fair societies should look like.
A new measure of unfairness
But how can we do better? In a first step, it was important to understand which types of inequality should be considered unfair. Therefore, we dug into the literature on political philosophy and behavioural economics.
Two contenders emerged. On the one hand, equality of opportunity. This principle states that inequalities are unfair if they caused by factors that are not the responsibility of individuals; think of inequalities across gender, race or the wealth of your parents. On the other hand, freedom from poverty. This principle states that inequalities are unfair if people cannot make ends meet; think of people that cannot buy enough food, shelter or clothing. In a second step, we needed to integrate these principles into measures.
To this end, we constructed income distributions of an “ideal” world, i.e. income distributions where there is equal opportunity for everyone and nobody is poor. Then we compared this “ideal” state of the world against the “actual” state of the world: the more the two states diverge, the higher the level of unfairness in society.
Unfairness in the US and Europe
What do we learn when from this new measure? We assessed trends of unfair inequality in the US from 1969 to 2014 and compared the US to 31 European countries in 2010. In the US, total and unfair inequality had both doubled since the beginning of the 1980s. This increase in unfairness was driven by less equal opportunities between children coming from more and less advantaged families.
Across countries, the US ranks among the most unfair societies. Notably the most unfair European societies in 2010 were Greece, Portugal, Spain and Italy – that is, those countries most strongly affected by the European debt crisis in 2010. In contrast to the US, unfairness in these countries was not driven by less equal opportunities but by increases in poverty.
Take-aways
In this work, we provided a blueprint for how to measure the unfairness of income inequality. We used this measure to study the US and Europe and showed that unfairness in the US has increased over time, putting it among the most unfair societies in the West. Our indicators may provide important information in current debates on the fairness of income inequality and potential public policy responses.
This work is only is a first step in a larger research agenda. Which factors should be considered responsibility factors? When is a person poor? Answers to these questions are far from obvious, but are indispensable for the measurement of unfair inequality. We hope that our work helps to guide these conversations by making the (un)fairness of income inequality more transparent and accessible to a larger audience.
Measuring Unfair Inequality: Reconciling Equality of Opportunity and Freedom from Poverty is research by Paul Hufe, Ravi Kanbur and Andreas Peichl and is published in the Review of Economic Studies. It has been produced as part of DIAL’s IMCHILD project.
Latest Posts
Welcome to the DIAL research blog!
The DIAL blog contains short reflections from researchers about their work on the different DIAL projects. They are supported by journalist and writer Fran Abrams who co-edits the blog with Christine Garrington.